Network Troubleshooting Tools
Network troubleshooting is the process of acquiring information and collecting evidence to identify the root cause of a network outage or performance issue. Troubleshooting network issues is necessary to resolve the problem as soon as possible by performing corrective actions on the root cause.
Network Troubleshooting Guide
This network troubleshooting guide reviews the most common network problems before introducing the different network troubleshooting tools and techniques available. We organized this guide in the following sections:
Why Network Troubleshooting is Important
Network troubleshooting is a key aspect of network management that enables organizations to:
- Reduced network downtime – Efficient troubleshooting will reduce the amount of network downtime that digital services and information systems experience.
- Cost savings – Network outages cost money due to interrupted services, SLA penalties, and customer complaints that increase cancellations.
- Improved performance – Identifying bottlenecks, network slowdowns, and other performance degradation problems translates into better quality of service and overall productivity.
To achieve these benefits, organizations need to consider three main elements:
- The network tools they use,
- the network operations team that supports the network infrastructure,
- the processes and escalation procedures adopted.
Troubleshooting Common Network Issues
There are several types of problems that can happen in a network infrastructure. The most common network problems that require network troubleshooting include:
Hardware or link failures
This type of failures originates due to faulty network equipment, bad cabling such as degraded connectors or fiber optics, of natural events such as wind and flooding.
Internet issues
Internet outages happen almost every day, most of them are regional, others worldwide spread service interruptions. Even though these issues generally happen outside a private network infrastructure, it’s still important to be aware of them if they impact the organization.
Network slowness
Sluggish application performance could indicate a network congestion issue. When the traffic originated is higher than what the network is capable of, buffers start filling up, and routers start dropping packets.
Network configuration issues
Network configuration errors can cause total outages, slowness due to suboptimal configuration, or other unexpected behaviors. These types of failures can be hard to troubleshoot if the organization doesn’t have a configuration change management process in place nor a network configuration audit tool.
Wireless
WLANs can experience localized RF (Radio-Frequency) issues such as low signal or interference, infrastructure issues such as radius authentication failures, or client specific errors.
User error or perception
User perception is one of the most common network problems ? In the case where it’s not the network to be at fault, the support team is still required to show a proof of innocence; screenshots from a network monitoring tool, packet traces, and ping tests will provide the required data to exonerate the network.
Network Troubleshooting Tools
The following is a list of the most commonly used tools that help to troubleshoot network connectivity and performance issues. These tools are open source so anyone can use them.
ARP
The “Address Resolution Protocol” (ARP) enables TCP/IP hosts to identify the MAC address of a local host given it’s IP address. Networking vendors provide an arp command that enables the user to inspect the ARP cache, which lists the association between a MAC address and an IP address. Network administrators use ARP on a default gateway to check wether a host is reachable.
For instance, the following output displays all IP to MAC associations in a given network:
? (10.24.2.1) at 36:e4:20:5d:bf:78 on en0 ifscope [ethernet]
? (10.24.2.24) at 94:8d:85:af:b4:11 on en0 ifscope [ethernet]
? (10.24.2.29) at 5e:af:db:0c:a4:7a on en0 ifscope [ethernet]
? (10.24.2.30) at 4c:6c:df:fb:41:4d on en0 ifscope [ethernet]
? (10.24.2.33) at 0f:47:5a:1b:d9:6c on en0 ifscope [ethernet]
? (10.24.2.47) at 28:eb:96:27:c9:ff on en0 ifscope [ethernet]
? (10.24.2.50) at 23:29:80:68:a8:bf on en0 ifscope [ethernet]
? (10.24.2.61) at 90:1d:48:1e:14:86 on en0 ifscope [ethernet]
? (10.24.2.82) at 57:26:7e:7c:21:e3 on en0 ifscope [ethernet]
? (10.24.2.84) at 20:10:5d:cb:25:5d on en0 ifscope [ethernet]
? (10.24.2.88) at 96:1b:29:6e:57:0b on en0 ifscope [ethernet]
Ping
Ping is a widely used command to verify network connectivity issues, including response time. This command can be executed from any computer’s console, as almost any operating system supports it. When you execute ping, by default it sends one packet every second to the destination host that you passed as argument. If the destination host is up and running, reachable, and allowed to respond, it will reply with an echo_reply packet to each echo_request by the sender. If the network between the two hosts has packet loss, some of these echo_request/echo_reply packets will be lost. When there’s a network connection issues, all packets are lost.
The following output from a ping test against netbeez.net with 10 packets (option -c as count). The source receives only 9 out of 10 replies, so the packet loss is 10%.
% ping -c 10 netbeez.net
PING netbeez.net (141.193.213.10): 56 data bytes
64 bytes from 141.193.213.10: icmp_seq=0 ttl=59 time=8.135 ms
64 bytes from 141.193.213.10: icmp_seq=1 ttl=59 time=15.771 ms
64 bytes from 141.193.213.10: icmp_seq=2 ttl=59 time=16.383 ms
64 bytes from 141.193.213.10: icmp_seq=3 ttl=59 time=17.835 ms
64 bytes from 141.193.213.10: icmp_seq=4 ttl=59 time=9.219 ms
64 bytes from 141.193.213.10: icmp_seq=5 ttl=59 time=15.211 ms
64 bytes from 141.193.213.10: icmp_seq=6 ttl=59 time=8.148 ms
64 bytes from 141.193.213.10: icmp_seq=7 ttl=59 time=16.280 ms
Request timeout for icmp_seq 8
64 bytes from 141.193.213.10: icmp_seq=9 ttl=59 time=8.001 ms
--- netbeez.net ping statistics --- 10 packets transmitted, 9 packets received, 10.0% packet loss
round-trip min/avg/max/stddev = 8.001/12.905/17.835/3.817 ms
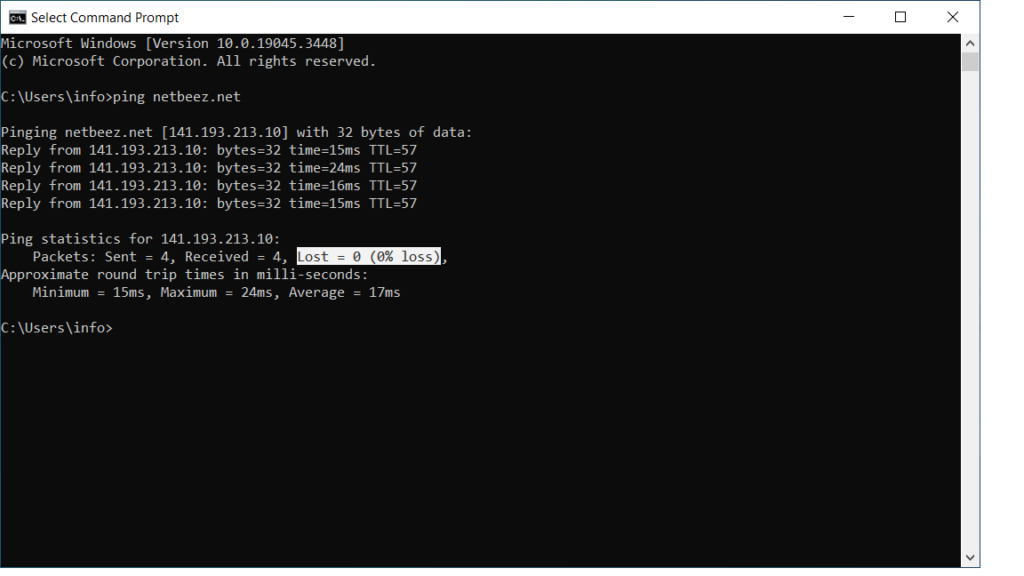
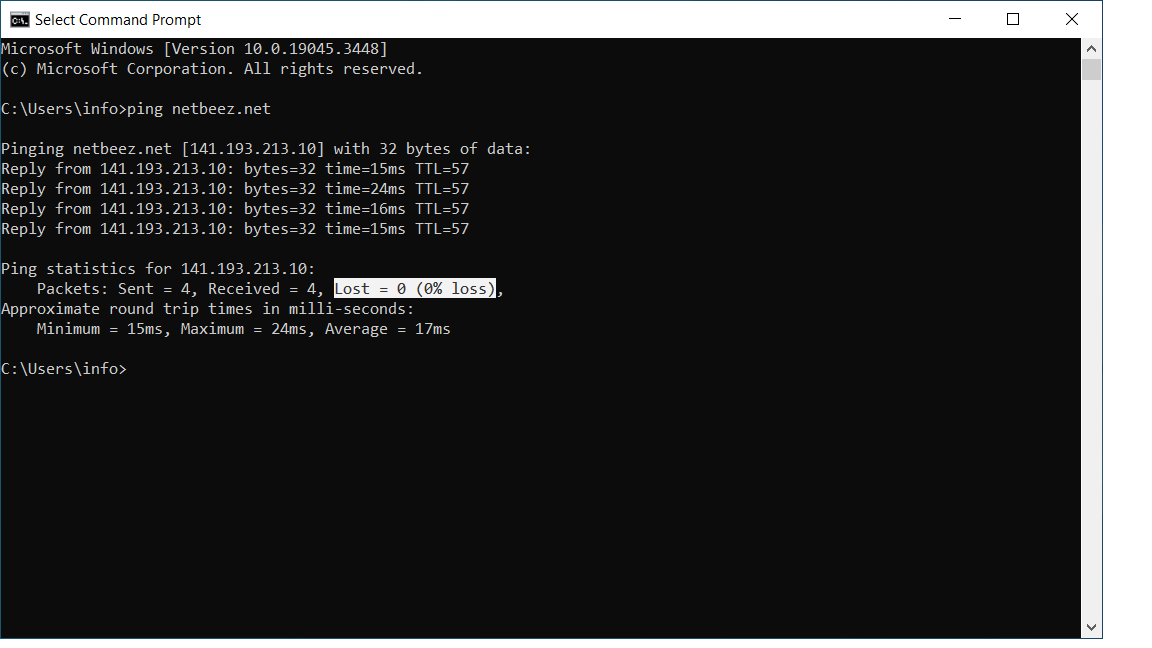
In Windows, just open a command prompt by typing cmd in the search bar next to the start menu. Once the command prompt opens, type ping followed by the remote IP or hostname. By default the windows ping runs 4 pings and then exists, reporting the packet loss. If you want to discover more ping options, read the article we wrote.
Traceroute
Traceroute is a network testing tool that discovers all the routers (or “routing hops”), and associated latency, between a source and a destination host. This command is valuable to discover what routes network traffic follow to reach a specific destination. In many cases, it helps pinpoint failure points, or suboptimal routes.
To run traceroute, open the command prompt and type the command followed by the destination host. Below are the traceroute results to www.google.com that reports each intermediate hop’s response time:
$ traceroute www.google.com
traceroute to www.google.com (172.217.7.132), 64 hops max, 52 byte packets 1 my.meraki.net (10.1.36.1) 10.140 ms 2.565 ms 3.272 ms 2 164.52.244.85 (164.52.244.85) 5.580 ms 4.006 ms 3.104 ms 3 64.58.254.226 (64.58.254.226) 4.069 ms 2.501 ms 5.308 ms 4 * * * 5 * * * 6 google-level3-60g.washingtondc.level3.net (4.68.71.186) 85.500 ms 9.336 ms 8.873 ms 7 108.170.246.1 (108.170.246.1) 10.156 ms 10.853 ms 13.887 ms 8 216.239.54.205 (216.239.54.205) 8.865 ms 9.400 ms 9.387 ms 9 iad30s08-in-f132.1e100.net (172.217.7.132) 9.145 ms 9.527 ms 12.434 ms
$
By default, traceroute uses the ICMP protocol on Windows, UDP on Linux and Mac OS. Both operating systems also have the option to change the transport protocols, such as TCP and GRE (on Mac OS X).
MTR
MTR, which stands for Matt’s Traceroute, merges the functionalities of traceroute and ping. Like traceroute, it discovers all the routers between the source and destination, those at least that reply to requests. Like ping, it runs ping tests against all the discovered routers, and reports latency and packet loss.
MTR can be used to pinpoint network slowdown issues at various points along the path(s) to the destination. In the following screenshot you can see that hops 3, 4, and 5 are having more than 25% of packet loss. That could indicate performance issues along the Internet path.

Nmap
Nmap is an open source network scanner. The tool has many functions, including ping sweep to discover mulituple devices in a specific network that respond to ping requests, or discover which TCP/IP ports a remote host has open or closed. The following output displays a port scan
nmap -O 172.31.0.1 Starting Nmap 6.00 ( http://nmap.org ) at 2018-12-18 00:58 EST
Nmap scan report for 172.31.0.1
Host is up (0.00039s latency).
Not shown: 997 closed ports
PORT STATE SERVICE
22/tcp open ssh
25/tcp open smtp
111/tcp open rpcbind
MAC Address: 00:01:C0:15:A3:32 (CompuLab)
Device type: general purpose
Running: Linux 2.6.X|3.X
OS CPE: cpe:/o:linux:kernel:2.6 cpe:/o:linux:kernel:3
OS details: Linux 2.6.38 - 3.2
Network Distance: 1 hop
Netstat
Netstat is a command-line tool that gathers network statistics from the local host. The command is available in various operating systems, including Linux, Mac OS, and Windows. It displays network-related information such as active network connections, routing tables, interface statistics, masquerade connections, and multicast memberships. Netstat provides details about the network connections established on a system, including the protocol used (TCP or UDP), local and foreign addresses, state of the connection, and more. It’s commonly used for troubleshooting network-related issues, monitoring network activity, and diagnosing network performance problems.
% netstat
Active Internet connections
Proto Recv-Q Send-Q Local Address Foreign Address (state)
tcp4 0 0 192.168.0.172.64868 203.190.113.78.https CLOSE_WAIT
tcp4 0 0 192.168.0.172.64864 91.219.237.205.https ESTABLISHED
tcp4 0 0 192.168.0.172.64860 107.55.35.146.https ESTABLISHED
tcp4 0 0 192.168.0.172.64859 157.240.7.22.https ESTABLISHED
tcp4 0 0 192.168.0.172.64858 104.16.118.116.https ESTABLISHED
tcp4 0 0 192.168.0.172.64857 172.217.12.238.https ESTABLISHED
tcp4 0 0 192.168.0.172.64856 104.18.241.108.https ESTABLISHED
tcp4 0 0 192.168.0.172.64855 64.233.189.95.https ESTABLISHED
tcp4 0 0 192.168.0.172.64854 151.101.1.69.https ESTABLISHED
tcp4 0 0 192.168.0.172.64853 198.35.26.96.https ESTABLISHED
Nslookup
Nslookup is a command that resolves a given hostmame, or Fully Qualified Domain Name, to verify if DNS works. This command is essential to verify if a DNS server works. Similar commands include host and dig.
By default, nslookup will use the DNS server configured on the host.
$ nslookup google.com
Server: 8.8.8.8
Address: 8.8.8.8#53 Non-authoritative answer:
Name: google.com
Address: 172.217.164.110
The user can also specify a DNS server to test as second argument:
$ nslookup google.com 1.0.0.1
Server: 1.0.0.1
Address: 1.0.0.1#53 Non-authoritative answer:
Name: google.com
Address: 216.58.194.206
Tcpdump
Tcpdump is a tool that allows you to capture network connections and do TCP/IP packet analysis. This command allows you to sniff all traffic that goes in and out of all interfaces. More importantly, it has the ability to filter the traffic by interface, host, destination or source host, type of traffic, and many other criteria. During troubleshooting, it’s important to isolate the packets that are relevant to the undergoing issue.
Wireshark
Wireshark is, in essence, a GUI-based packet capture utility similar to tcpdump.
Network Troubleshooting With the Layered Methodology
When troubleshooting network problems, it’s very important to keep the OSI model in mind and work your way up from the lower physical layer to the application layer.
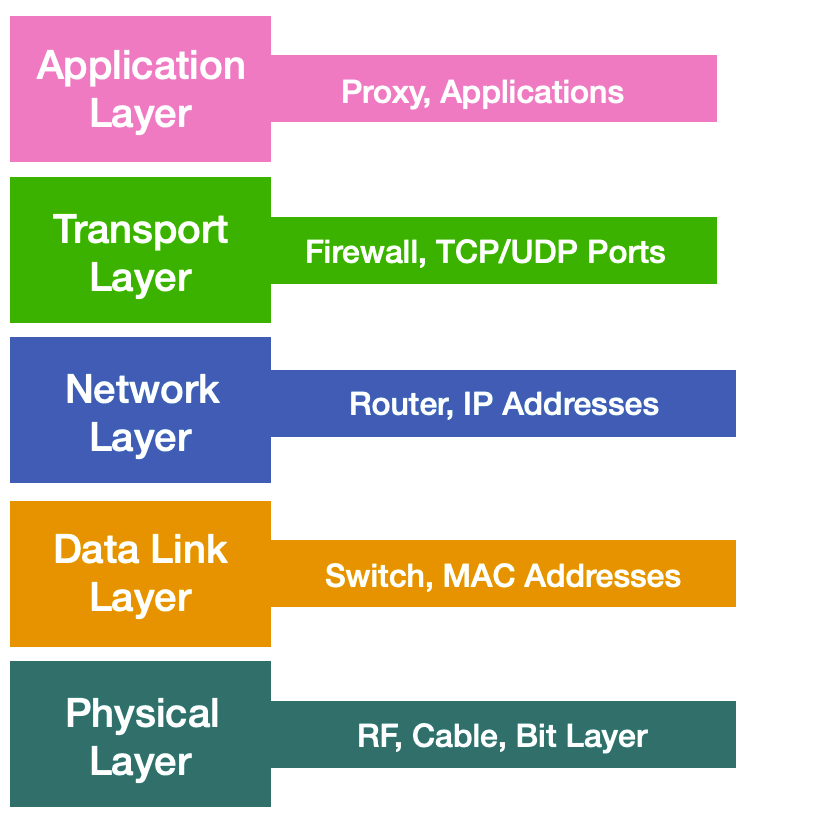
This bottom-up approach helps to successfully troubleshoot network problems because each layer relies on the lower one to function properly. In the following sections, we’ll provide the network troubleshooting steps that a network engineer can follow to work their way up from the first four layers of the OSI model.
Troubleshooting the Physical Layer (OSI Layer 1)
The physical layer includes anything that generates and moves bits from point A to point B. In this layer, the network troubleshooter will focus on the physical connectivity issues that relate to Ethernet or WiFi cards, fiber cables and, in case of wireless communications, the air. To troubleshoot this layer, the network administrator can use the diagnostic tools that the hardware vendors include in their hardware.
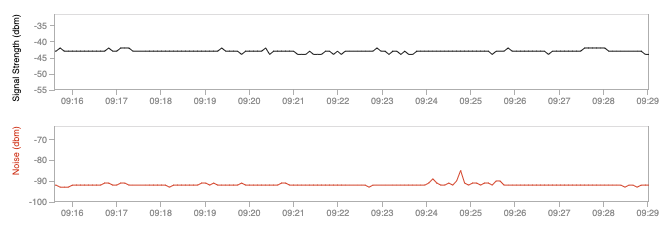
In the case of Ethernet cards, basic diagnostic commands report information on the duplex and link speed that the card has established with the other side of the cable. In the case of a WiFi adapter, the utility should report the signal strength and link quality of the network connection established with the base station or ad-hoc peer. This data is important to understand the quality of the layer 1 link established. In the following screenshot you can look at the signal strength and noise of a wireless laptop.
Time-Domain Reflectometer
To troubleshoot physical connectivity issues with copper or fiber cables you can use a Time-Domain Reflectometer (TDR) or optical time-domain reflectometer in the case of a fiber link. Some networking vendors also include basic TDR functions on their equipment. In the case of WiFi networks, spectrum analyzers are very useful to provide information about “the air” and detect any interferences in the surroundings, such as microwave ovens.

Speed and Duplex Mismatch
Troubleshooting speed and duplex issues on a switch involves identifying and resolving problems related to the communication speed and duplex settings between network devices. Speed refers to the rate of data transfer, while duplex refers to the ability of a network interface to send and receive data simultaneously. Mismatched speed and duplex settings between devices connected to a switch can result in performance issues, packet loss, or network instability. To address these issues, start by verifying the configuration settings on both the switch ports and the connected devices. Ensure that both sides are set to the same speed (e.g., 1000 Mbps) and duplex mode (e.g., full-duplex or half-duplex).
The command “show interface” on a Cisco switch will provide the initial information required to troubleshoot speed and duplex issues:
switch# show interfaces FastEthernet0/48
FastEthernet0/48 is up, line protocol is up Hardware is Fast Ethernet, address is 0006.5315.7bf0 (bia 0006.5315.7bf0)
MTU 1500 bytes, BW 100000 Kbit, DLY 100 usec, reliability 255/255, txload 1/255, rxload 1/255
Encapsulation ARPA, loopback not set
Keepalive not set
Auto-duplex (Full), Auto Speed (100), 100BaseTX/FX
ARP type: ARPA, ARP Timeout 04:00:00
Last input never, output 00:00:00, output hang never
Last clearing of "show interface" counters never
Queueing strategy: fifo
Output queue 0/40, 0 drops; input queue 0/75, 0 drops
5 minute input rate 2000 bits/sec, 2 packets/sec
5 minute output rate 4000 bits/sec, 3 packets/sec
205385758 packets input, 241258690 bytes
Received 24038 broadcasts, 0 runts, 0 giants, 0 throttles
0 input errors, 0 CRC, 0 frame, 0 overrun, 0 ignored
0 watchdog, 59 multicast
0 input packets with dribble condition detected
510049439 packets output, 2222557135 bytes, 0 underruns
0 output errors, 0 collisions, 1 interface resets
0 babbles, 0 late collision, 0 deferred
0 lost carrier, 0 no carrier
Troubleshooting the data-link layer (OSI Layer 2)
To troubleshoot the data-link layer issues, the network troubleshooter will focus on the local network. In the case of Ethernet local network connections, the engineer can access the command line of the switch to inspect the MAC address table, which provides information about the MAC addresses learned on switched ports. The command “show mac-address-table” on a Cisco switch returns all the MAC addresses registered in the content addressable memory of the switch:
switch#show mac-address-table
Dynamic Address Count: 36
Secure Address Count: 0
Static Address (User-defined) Count: 0
System Self Address Count: 75
Total MAC addresses: 111
Maximum MAC addresses: 8192
Non-static Address Table:
Destination Address Address Type VLAN Destination Port
------------------- ------------ ---- --------------------
0007.3252.b1f0 Dynamic 1 FastEthernet0/31
000c.2909.faee Dynamic 1 FastEthernet0/31
000c.2958.71c1 Dynamic 1 FastEthernet0/31
000c.2974.5c6e Dynamic 1 FastEthernet0/31
000c.29ab.6b03 Dynamic 1 FastEthernet0/31
000c.29f6.0e8f Dynamic 1 FastEthernet0/31
000c.8507.6500 Dynamic 1 FastEthernet0/31
000c.8507.6501 Dynamic 1 FastEthernet0/31
001f.c977.1d81 Dynamic 1 FastEthernet0/31
001f.c977.1dc0 Dynamic 1 FastEthernet0/31
0242.2deb.5d35 Dynamic 1 FastEthernet0/31
...
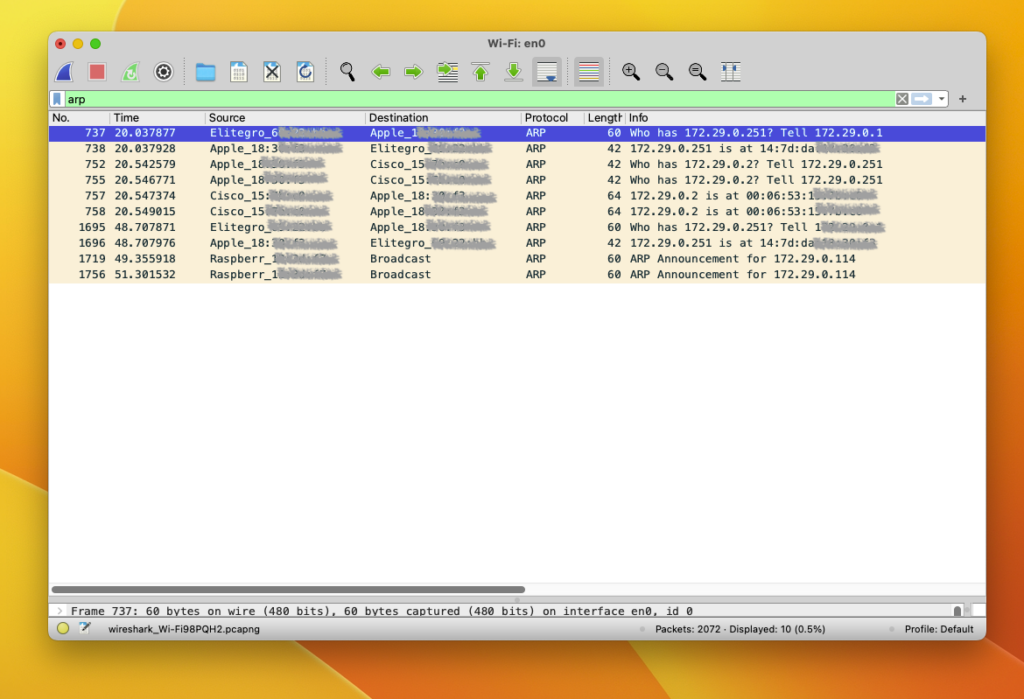
To troubleshoot Layer 2 communications between hosts, network engineers can use passive analysis tools such as wireshark, which is GUI based, or tcpdump, which is command line based. Such tools provide a recording of frames, flowing across a network link, switch or host. In the following screenshot you can see the case of a wireshark packet capture in Mac. The user can input filters to capture and display only certain traffic.
Spanning Tree Protocol
Another important thing to keep in mind when troubleshooting layer 2 issues is the spanning tree protocol. Spanning tree is a Layer 2 protocol that enables switched networks to build a loop-free topology, which happens when redundancy is introduced in a network design. When a network topology has a loop, frames flow indefinitely without reaching its destination host or getting discarded, causing broadcast storms. Broadcast storms saturate network links and cause instability in the CAM (Content Addressable Table) of switches. The spanning tree protocol avoids this scenario by disabling switch ports that cause loops. However, for spanning tree to properly work, all switches in the network must be correctly configured. Getting familiar with the spanning tree protocol and diagnostic commands on switches is a very important knowledge for network troubleshooting.
Troubleshooting the network layer (OSI Layer 3)
The most used commands to troubleshoot layer 3 issues are ping and traceroute. With ping you can verify whether a host can reach a destination network or host. With traceroute you can discover the routing hops available between a source and a destination. When troubleshooting layer 3 problems, it’s important to consider whether the destination host is located within your organization, or not. If it does, then the troubleshooting efforts aim at figuring out whether a network misconfiguration, or something else, is causing the connectivity or performance issues. If, on the other end, the network path to the destination host traverses a third party, then it’s important to provide enough information and prove that it’s someone else’s problem. One way or another, ping and traceroute are two useful commands that shed light on reachability and performance issues between two IP hosts.
Troubleshooting the transport layer (OSI Layer 4)
The transport layer is responsible for ensuring that application data is exchanged between two hosts. TCP provides a connection-oriented option, and UDP a connectionless. At this layer there are several things that could prevent applications from working, so different commands come to play. Here are some of the common causes of layer 4 network issues:
- Protocol settings on the source or destination host, including host firewalls that block inbound or outbound traffic; Windows, Mac, and Linux have a netstat command that reports all open TCP/IP socket connections; to troubleshoot host firewalls, each system will have its own flavor (for instance in Linux iptables is a pretty common option).
- Network firewalls between the source and the destination host that block connection attempts; to troubleshoot if a firewall is blocking a service from working, you can use a command like telnet in the case of TCP or the open source nmap, which has several capabilities and scans available (disclaimer: scanning Internet and third-party hosts without authorization can be prosecuted).
- Overlay networks are sources of MTU mismatches causing some applications to function inconsistently based on the request or payload. Troubleshooting MTU can be done with a ping test by setting the Don’t Fragment bit (DF) and forcing the MTU to a required amount in line with application’s requirements. Traceroute also offers an option to test the path MTU end-to-end.
Troubleshooting the application layer (OSI Layer 7)
Network troubleshooting typically concludes at the transport layer, but it remains crucial to incorporate fundamental application troubleshooting into the procedure. This step ensures that a given issue is not potentially triggered by application behavior. Furthermore, as certain problems may solely manifest within an application context, scrutinizing application logs and conducting tests through the application interface aids in pinpointing the underlying cause of a potential network problem. In cases of application outages where the source of the issue is unclear, whether it pertains to the network or the application itself, it is advisable to engage in collaborative troubleshooting efforts involving both network and application teams, rather than pursuing isolated approaches. This collaborative approach aims to expedite issue resolution by leveraging the expertise of both teams.
Network Monitoring Tools
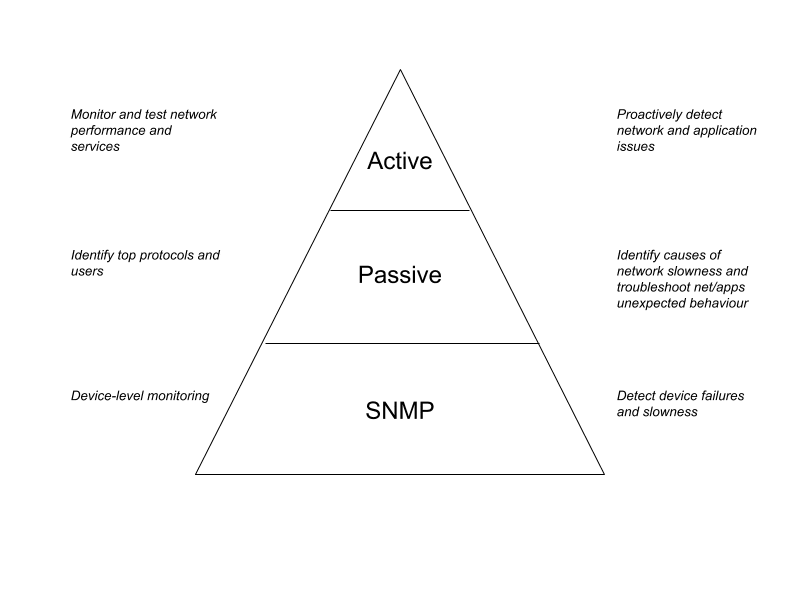
In the context of network troubleshooting, network monitoring tools provide alerting, diagnostic data, network performance metrics, logs, and statistics. During the troubleshooting process, support personnel may need to review data from different sources, such as:
SNMP pollers
Provide the status and diagnostic data on network devices; SNMP helps identify events such as hardware or link failures, software errors or bugs, and anything else that could affect a network component.
Passive analyzers
These tools help identify bottlenecks caused by one or more devices saturating a network’s bandwidth or specific portions of it; they can also inspect sequences of packets to pinpoint performance issues between a client and a server.
Active monitoring tools
Active measures include end-to-end reachability, round-trip-time, packet loss and other network metrics; tools like NetBeez alert on network performance degradation issues, and collect metrics around the end-user experience of network services and applications.
Since each tool type provides information about a specific aspect of the network, companies should have each one of them in place.
Help Desk and Support Team
The significance of human resources in network troubleshooting cannot be overstated. Networks, the digital backbone of modern organizations, depend fundamentally on skilled individuals to function optimally. Without dedicated professionals who possess the knowledge and expertise to diagnose and resolve network issues, troubleshooting simply cannot occur effectively. Therefore, organizations must prioritize investments in their workforce, offering continuous training and fostering a workplace culture that values and retains employees. By doing so, they not only ensure the seamless operation of their networks but also empower their teams to proactively address challenges and drive innovation in the ever-evolving field of network management.
Support Tiers and Escalations
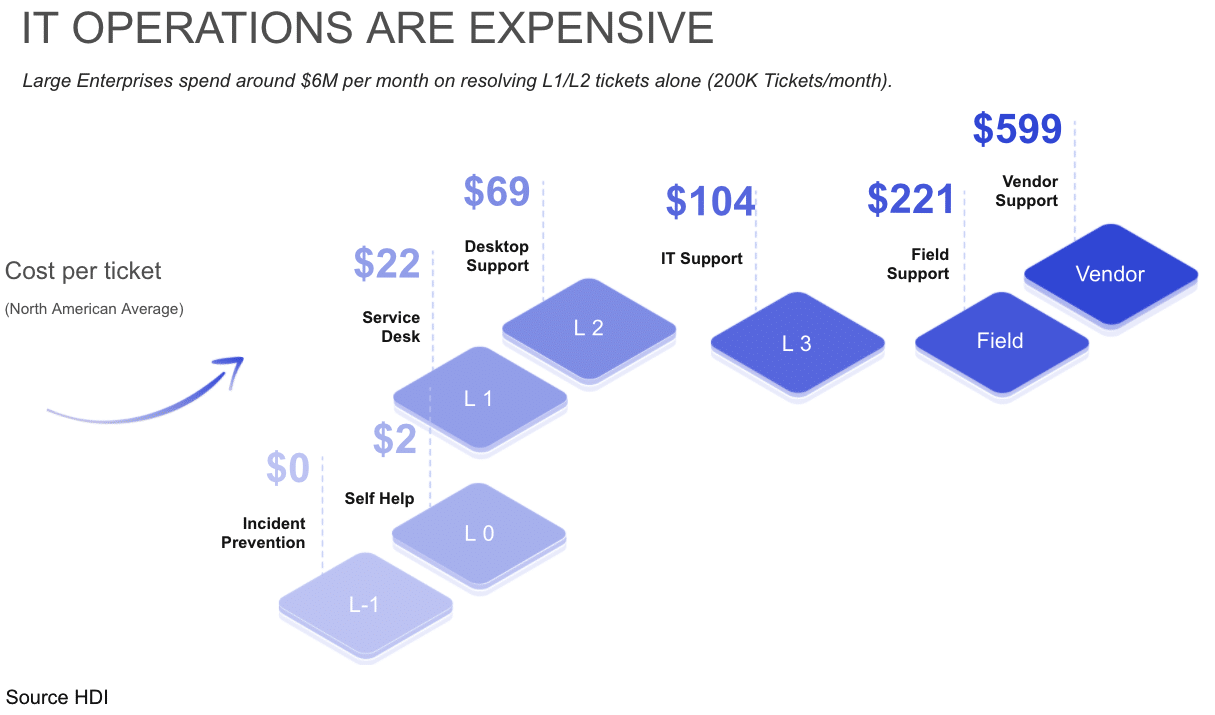
Support teams are often organized into tiers to efficiently manage and resolve customer issues. Many organizations adopt a three tiered approach, organized the following way:
- Tier 1 handles initial customer inquiries, offering basic troubleshooting and solutions to common problems; the Tier 1 team is mostly composed of help desk or support agents.
- Tier 2 consists of specialists with deeper technical expertise who take care of more complex or unresolved issues; generally Tier 2 personnel are also operating within a Network Operations Center (NOC).
- Tier 3, the highest level, tackles the most intricate and critical issues, often involving complex systems or network configurations; in this tier we generally find Network Engineers or Architects whose primary responsibility is the design and implementation of network solutions.
This approach streamlines the support process, ensuring that each team focuses on issues that match their skill level. Ultimately this organization leads to quicker problem resolution, improved customer satisfaction, and lower support costs. When analyzing and optimizing support costs, consider three factors:
- number of tickets,
- average time spent on tickets, and
- number of ticket escalations.
These three metrics are directly proportional to support costs. One easy way for organizations to reduce costs is to adopt network monitoring tools that enable lower tiers to troubleshoot issues that would have to be escalated to the higher, more expensive, tiers.
Reduce Troubleshooting Time with NetBeez
NetBeez is an active network monitoring platform that enables operations and support teams to quickly troubleshoot performance issues from the user’s perspective. The solution relies on distributed network monitoring agents that provide end-to-end network and application performance metrics. NetBeez has three key pillars that make it a good solution for network troubleshooting.
Granular Performance Data
NetBeez captures granular network performance metrics to applications and services.
- Performance metrics up to one second interval
- Help isolate with accuracy the exact time and moment when a problem occurs
- Retains historical data to generate baselines, identify trends and recurring issues to perform root cause analysis

Proactive Incident Detection
Netbeez agents run real-time tests, end-to-end, and from the user perspective.
- Continuous active monitoring against networks and applications
- Quick detection and alerting on service failures and performance degradation
- Enforce and guarantee quality of service and SLAs
- Verify and validate configuration changes during maintenance windows
Multi-Platform Deployment
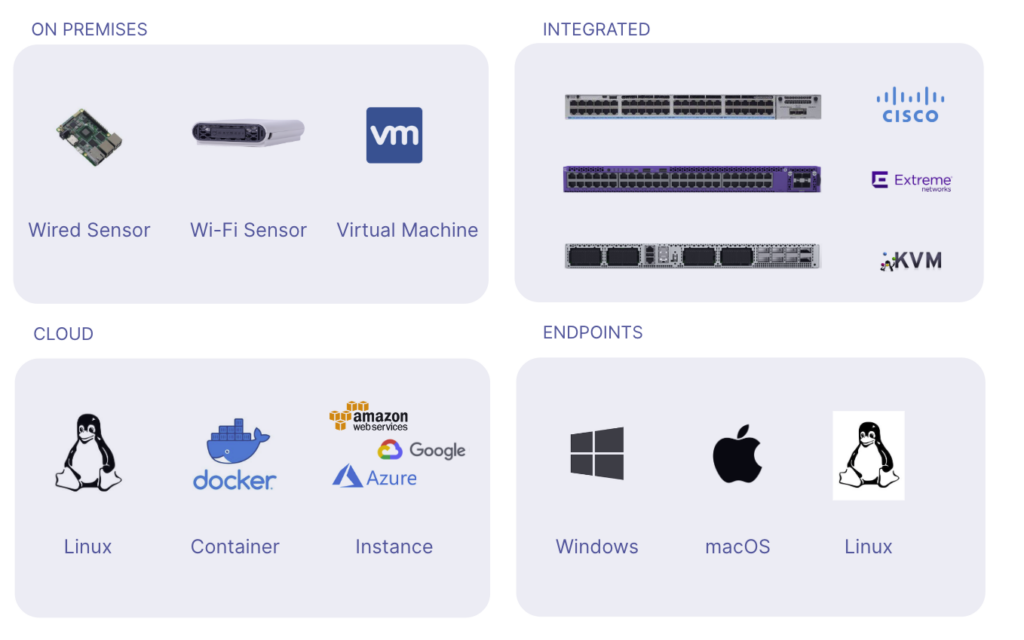
The solution supports flexible deployment options for on-prem, cloud, and remote.
- Deploy the server on-premises as a virtual appliance or in the cloud as an instance
- Support Ethernet, Wi-Fi, virtual, Docker, and Linux based agents
- Support Windows and Mac clients
- Easily orchestrate and deploy at scale
Conclusion on Network Troubleshooting
Network troubleshooting is a key aspect of network management that requires proper investment in tools and resources. Organizations adopt a three tier approach to handle ticket response and escalation. When troubleshooting network performance issues, it’s very important to keep in mind the OSI model and its layers. Starting from the bottom layers and moving your way up will assure that the proper troubleshooting procedures with faster problem resolution. If you are a network administrator looking to automate network troubleshooting with a network monitoring tool, request a NetBeez demo.
