Linux for Network Engineers: How to use gping
Recently, we talked about prettyping, and continuing our mini-series on the different kinds of ping tests, here we’ll talk about gping.
Gping stands for “Graphical ping”; it’s an open source free project. It gives a plot of the ping latency to a host, but the most useful feature is the ability to run concurrent pings to multiple hosts and plot all of them on the same graph. This makes latency comparison easy and intuitive. As an added bonus, it can plot the execution time of CLI commands. Let’s see how all these work.
Installation
The installation instructions for all the supported operating systems (Linux, Windows, MacOS) can be found on the project’s Github page.
I followed the instructions for Linux and I (along the way) I got the following error message:
|
netbeez$ wget -qO – https://azlux.fr/repo.gpg.key | sudo apt-key add – E: gnupg, gnupg2 and gnupg1 do not seem to be installed, but one of them is required for this operation |
As the error suggested I installed gnupg and after that I repeated the steps and it worked as expected. So, for me the Linux installation was as follows:
|
netbeez$ echo “deb http://packages.azlux.fr/debian/ buster main” | sudo tee /etc/apt/sources.list.d/azlux.list netbeez$ apt-get install gnupg netbeez$ wget -qO – https://azlux.fr/repo.gpg.key | sudo apt-key add – netbeez$ apt update netbeez$ apt install gping |
As the error suggested I installed gnupg and after that I repeated the steps and it work
I used a fresh Linux box for this test, and gnupg wasn’t installed, but I expect that most of you already have it pre-installed. So, you might not come across this error message.
In addition, on the release page of the project you can find precompiled executables for all the supported operating systems and platforms.
Usage
Gping has very few options as you can see all below:
|
1 2 3 4 5 6 7 8 9 10 11 12 13 14 15 16 17 18 19 20 |
netbeez$ gping –help gping 1.2.1-alpha.0 Ping, but with a graph. USAGE: gping [FLAGS] [OPTIONS] [hosts-or-commands]… FLAGS: –cmd Graph the execution time for a list of commands rather than pinging hosts -h, –help Prints help information -4 Resolve ping targets to IPv4 address -6 Resolve ping targets to IPv6 address -V, –version Prints version information OPTIONS: -b, –buffer <buffer> Determines the number of seconds to display in the graph. [default: 30] -n, –watch-interval <watch-interval> Watch interval seconds (provide partial seconds like ‘0.5’) [default: 0.5] ARGS: <hosts-or-commands>… Hosts or IPs to ping, or commands to run if –cmd is provided. |
If you are looking for the advanced options the regular ping has (e.g. packet size, TOS, ttl) you won’t find them with gping.
It’s basic functionality is to run a basic ping test and get the following output:
|
netbeez$ gping 1.1.1. |

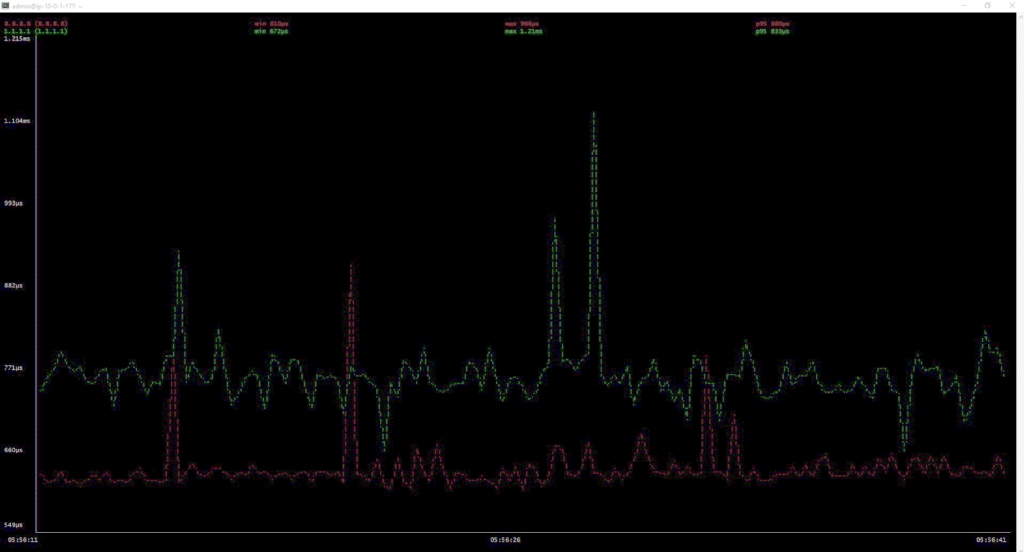
I find the ability to compare latency plots to different hosts really unique and informative. For example, below you see the latency graph to 8.8.8.8 and 1.1.1.1.
I find the ability to compare latency plots to different hosts really unique and informative. For example, below you see the latency graph to 8.8.8.8 and 1.1.1.1.
Finally, with the —cmd [command] option you can pass a command to gping, it will execute it, and plot its execution time. Here is the execution-time plot of ls–la:

You can also select your choice of IPv4 or IPv6 resolution, the plot duration, and the interval. For me, the most useful feature is the ability to plot latency results to multiple hosts on the same graph (in the example above, I put just two, but you can have up to a dozen or more if you want).

