How We See Data And How We Act: Lessons From The Covid-19 Pandemic
The world is awash in Covid-19 data. Has this information helped?
A new study looks at how public knowledge, the perception of risk, and behavioral intentions were influenced by six different maps showing the prevalence of Covid-19 in the US on May 11, 2020.
The upshot.
Having data about the number and distribution of Covid-19 cases had very little effect overall. In fact, respondents in a control group, who were not provided with any data at all, performed better on a test of knowledge about the current state of the epidemic than respondents provided with data.
The idea for this study was brilliant, capitalizing on a variety of data visualizations provided by a range of credible sources at a time when the public was expressing a great deal of interest.
The maps.
To measure the association of different ways of visualizing spatial data with viewers’ knowledge, risk perceptions, and behavioral intentions, researchers selected six different maps that varied according to their attributes. Some reported data at the state level while some were at the county level.
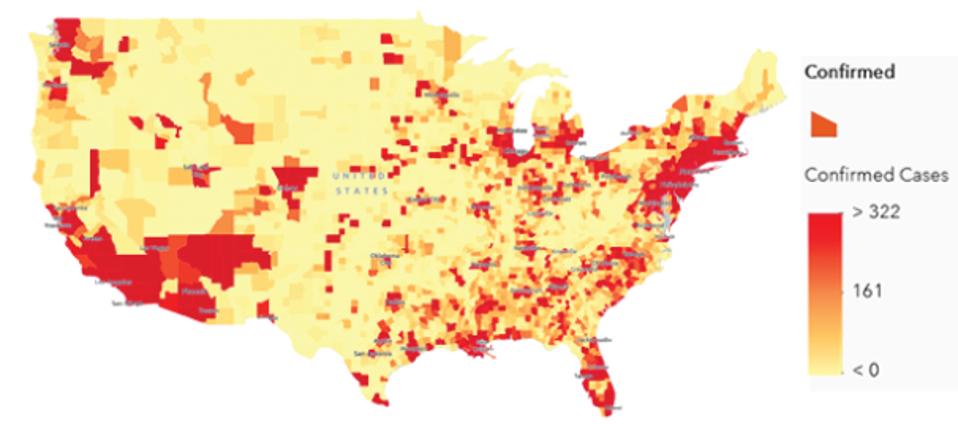
A map produced by researchers at Johns Hopkins University shows the prevalence of Covid-19 in the US … [+]
Modified from https://jamanetwork.com/journals/jamanetworkopen/fullarticle/2774639.
MORE FOR YOU
Some used “bubbles” to illustrate the size of the epidemic, while others used a color gradient referred to as a “heat map”.
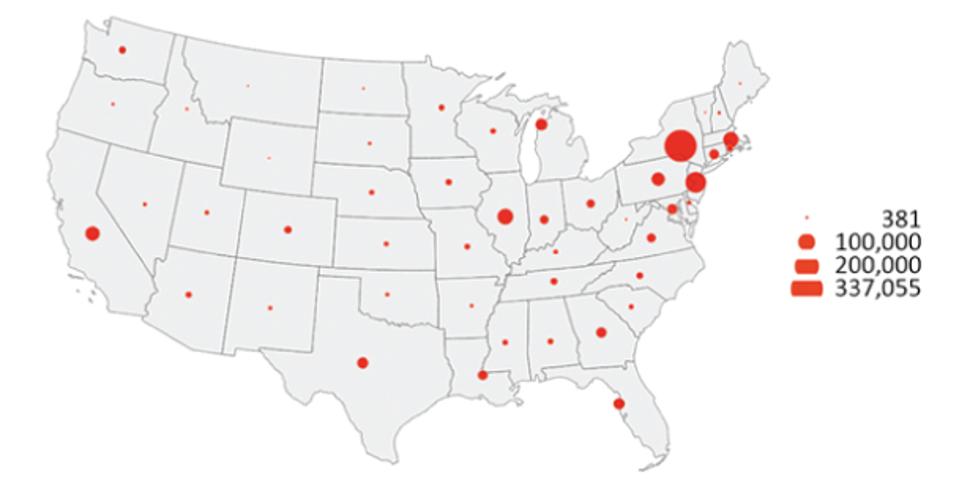
A map produced by the Kaiser Family Foundation shows the prevalence of Covid-19 in the US using a … [+]
Modified from https://jamanetwork.com/journals/jamanetworkopen/fullarticle/2774639.
Finally, some maps were expressed in terms of the total number of cases and others as the number of cases per capita.
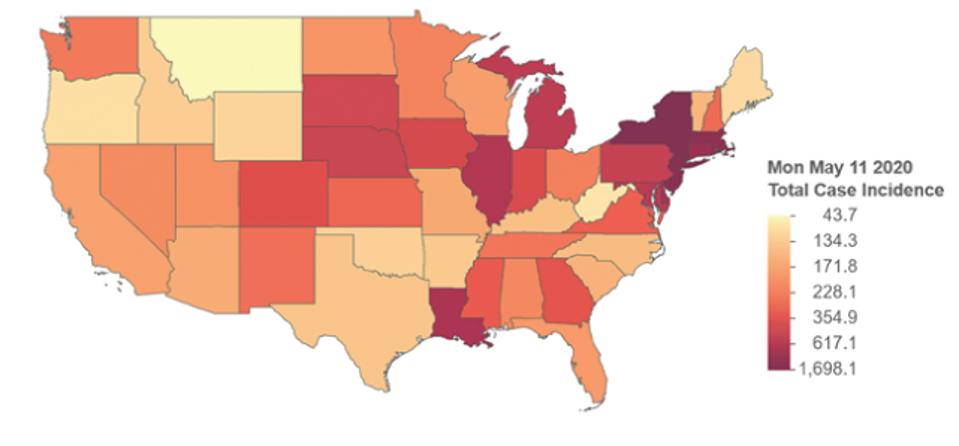
A map produced by researchers at the University of California Davis shows the incidence of Covid-19 … [+]
Modified from https://jamanetwork.com/journals/jamanetworkopen/fullarticle/2774639.
Survey respondents were provided with just one of these maps and tested on their knowledge about the total number of cases and cases per capita, perception of individual and societal risk, and intentions regarding adherence to Covid-19 guidelines.
The Findings.
Maps of prevalence (per capita cases) translated poorly to knowledge about total cases. Knowledge about the total number of cases was greater among respondents who had viewed maps showing total cases than per capita cases. This is not surprising. What is surprising is how great the difference was.
Certain types of maps significantly improved knowledge of prevalence:
- Heat maps (also known as choropleths) work better than bubble maps. This is interesting because choropleths tend to de-emphasize the importance of big cities vs rural areas. Small areas with high prevalence can be hard to see on the map.
- State-level maps work better than county-level maps. Perhaps this is because there are fewer states than counties. To comprehend the whole requires “adding up” the different states, or else applying some other mental process that approximates a sum. Doubtless, this is easier to do with 48 states displayed compared with 3,108 county and county-equivalents. (Alaska and Hawaii are excluded from the maps.) This is especially interesting because the county data are more accurate, at least in the sense that they provide a more precise description of the locations where cases are concentrated. (So the usual advice about using the smallest area units for choropleths may not be the right advice in this case. Perhaps state-level maps in this case overcome the disadvantages of choropleths with respect to small areas like urban counties.)
- Per capita maps work better than maps of total cases. (Not surprising.)
Viewing maps of any kind had no impact on individual risk perception. There was no evidence that any aspect of the presentation of data, or even the presentation of data itself, had any effect on individual risk perception. This is disheartening. Given that there was nothing wrong with the data itself (but see more about this below), the reason why is something that greatly needs to be further investigated.
Viewing maps made viewers slightly more optimistic about societal risk. Societal risk perception — measured in terms of optimism or pessimism that epidemic conditions would improve within two weeks — was weakly influenced by being shown a map. What kind of map didn’t matter. Interestingly, respondents who viewed a map were more optimistic than respondents who weren’t provided any data.
Viewing maps had no influence on behavior. There was no evidence for any effect of data on intent to adhere with protective guidelines.
Viewing maps led to less accurate knowledge about total cases than having no information at all.
These results are striking. In particular, they suggest that access to information of a kind widely disseminated during the early months of the Covid-19 pandemic had virtually no impact on public understanding of the epidemic. Even more striking is the counter-intuitive result that being presented with data was sometimes worse than not being presented with data at all.
What explains this and does it matter?
The explanation.
The especially surprising finding was the last one, that viewing maps seemed to result in a reduction in knowledge. My hypothesis is that this isn’t a general pattern, but a result of the study design. We know from details reported in the study (the first major finding above) that respondents presented with maps of prevalence (i.e. maps of the number of cases per capita) answered questions about the total number of cases more poorly than those with maps showing the total number of cases. This makes sense. Even if you properly understand what information is presented in maps of prevalence, unless you know where the population is concentrated (either because you’re sufficiently familiar with the geography of the US or because you are also presented with maps of population size), there is no way to draw an inference about the total number of cases. One might even suppose that the information presented by prevalence maps is detrimental to knowledge about total cases, because it is misleading, because it is a measure of something very different.
So, respondents presented with prevalence maps are expected to demonstrate less knowledge of total cases. These prevalence maps comprised two of the six maps presented. Thus, roughly one-third of respondents presented with maps were presented with detrimental information. If the difference between having no information (no map presented) and good information (a map of the total number of cases) is negligible, then it is to be expected that the difference between the group with no information (no map presented) and a group with contaminated information (two-thirds having good information and one third having detrimental information), would be marginal, but negative. This is, in fact, what the researchers found.
What have we learned?
First, raw data were of minimal value to the average respondent. Second, scientists, data journalists, bloggers, and others who curate and present data for the public should be aware that there are perceptual consequences to the way in which data is presented (for instance heat maps vs. bubble maps). Finally, and most importantly, there remains considerable scope for improving general knowledge about how to interpret data and quantitative information, and how to design optimal visualizations. The gaps between those with and without access to data — with respect to knowledge, risk perception, and behavioral intent — were small. But they should be large. Data should be informative, especially concerning a situation, such as the Covid-19 pandemic, where there is a great deal of confusion and uncertainty. In a society that increasingly relies on data for making important decisions, it is crucial that the population be knowledgeable about the interpretation of graphs and figures.